
Icelandic Transport Authority
Accident Map
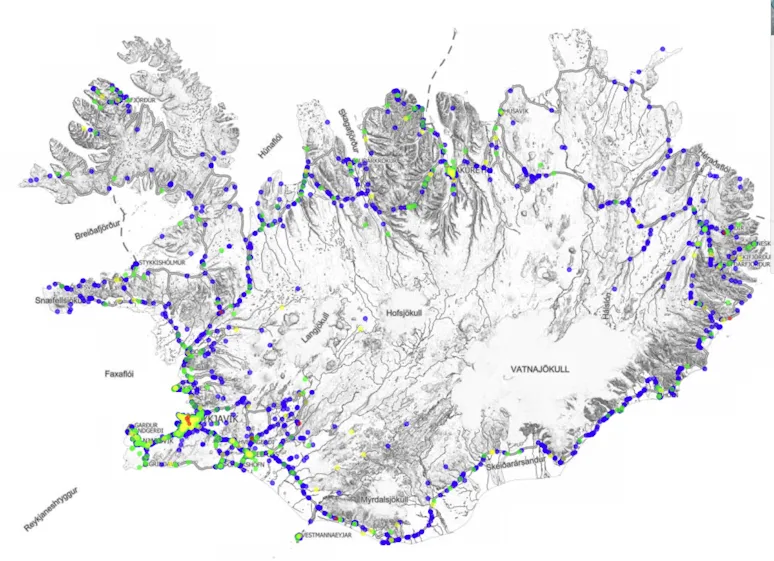
IceTRA Accident Map
The accident map provides detailed information about road traffic accidents that have occurred in Iceland from 2007 up to and including 2025.
Instructions for using the accident map
Types of accidents and severity
You can filter by type of incident: incident without injury, minor accident, serious accident or fatal accident. See instructions.
Heat map
Turn on the Heat map to see the density of accidents as a colour-coded area instead of dots — the more numerous and serious the accidents in an area, the “hotter” it becomes. The colours are always relative to what is currently in view, so they change when you change the time period, severity, accident type or zoom level. Note: urban areas generally “overwhelm” rural areas in comparison. See instructions.
Background image
Switch between map types with < and > at the top of the button bar: black and white map (default), coloured map, map+aerial photo combined, or a pure aerial photo. See instructions.
Information about individual accidents
Click on a dot to see a diagram of the incident, along with the time, location, vehicles and information about the injured. See instructions.
Data in table format
Click on the cogwheel in the top right. Select the button with the diamond/+ to the right of the two that appear. Click on each corner of the area you want to define (do not hold down the mouse button). Double-click on the last corner. → A table will appear with all accidents within the area — useful for neighbourhoods, municipalities or counties. See instructions.
Other available features
Real-time road conditions, weather information, services and recreation also appear on the map. The left button next to the cogwheel allows you to measure distances and areas. See instructions. Below is a video that goes over the main functions available on the map, and these functions are also explained below the video.